Observability
We will start this chapter with OpenTelemetry integration. OpenTelemetry can be used to collect all kinds of telemetry data: metrics, logs, and traces. We will focus on tracing in this example, and show how to generate metrics from those tracing events later.
OpenTelemetry integration
In this section we will implement the basics of OpenTelemetry integration.
What is OpenTelemetry? According to their site, opentelemetry.io:
"OpenTelemetry is a collection of tools, APIs, and SDKs. Use it to instrument, generate, collect, and export telemetry data (metrics, logs, and traces) to help you analyze your software’s performance and behavior."
We already use tracing in this application, but the events are simply written to the standard output. Using OpenTelemetry we can forward this data into various data collectors.
During this example I will use hyperdx.io as the data collector. They offer a free tier that is more than enough for our needs. Of course, you can use any other data collector that supports OpenTelemetry, like Jaeger, Grafana Tempo, etc.
To create a hyperdx.io account, go to their site and sign up. After you sign up, you will get an ingest API key. You will need this key to send the data to the collector.
You can find the sample codes on GitHub.
We already have a minimal tracing configuration in src/commands/serve.rs:
    let subscriber = tracing_subscriber::registry()
        .with(LevelFilter::from_level(Level::TRACE))
        .with(fmt::Layer::default());

    subscriber.init();
This one writes the events to the standard output. We will replace it with a more complex configuration that will forward the events to the HyperDX collector.
First, we need to add the OpenTelemetry dependencies to the Cargo.toml:
[dependencies]
opentelemetry = { version = "0.27", features = ["metrics", "logs"] }
opentelemetry_sdk = { version = "0.27", features = ["rt-tokio", "logs"] }
opentelemetry-otlp = { version = "0.27", features = ["tonic", "http-json", "metrics", "logs", "reqwest-client", "reqwest-rustls"]  }
opentelemetry-semantic-conventions = { version = "0.13.0" }
tracing-opentelemetry = "0.28.0"
The opentelemetry crate is the main crate that provides basics of the
OpenTelemetry implementation. The opentelemetry_sdk crate is the official
SDK for OpenTelemetry. The opentelemetry-otlp crate is the OpenTelemetry
protocol implementation, this one is used to actually send the data to the
collectors over the network.
The opentelemetry-semantic-conventions crate provides the semantic
conventions for the OpenTelemetry events. The tracing-opentelemetry crate
is the bridge between the tracing and opentelemetry crates.
Now we have to add an option to our application settings to enable the users to turn on the OpenTelemetry integration.
Add the following to the src/settings.rs:
#[derive(Deserialize, Debug, Clone)]
#[serde(rename_all = "camelCase")]
pub struct OtlpTarget {
    pub address: String,
    pub authorization: Option<String>,
}
and extend the Logging struct with the otlp_target field:
#[derive(Debug, Deserialize, Default, Clone)]
#[allow(unused)]
pub struct Logging {
    pub log_level: Option<String>,
    pub otlp_target: Option<OtlpTarget>,
}
This way we can configure the address of the collector and the authorization key in the application settings (either via a configuration file or via environment variables).
Now, to initate the OpenTelemetry integration, we have to modify the
src/commands/serve.rs file. First, we have to add the OpenTelemetry
initialization code. We have to import a log of things:
use crate::settings::OtlpTarget;
use opentelemetry::trace::{TraceError, TracerProvider};
use opentelemetry::{global, KeyValue};
use opentelemetry_otlp::{WithExportConfig, WithHttpConfig};
use opentelemetry_sdk::trace::{RandomIdGenerator, Sampler, Tracer};
use opentelemetry_sdk::{runtime, trace, Resource};
use std::collections::HashMap;
use opentelemetry_sdk::propagation::TraceContextPropagator;
Then we have to add the init_tracer function that will initialize the
OpenTelemetry integration based on the OtltTarget settings:
pub fn init_tracer(otlp_target: &OtlpTarget) -> Result<Tracer, TraceError> {
    // ...
}
This function will return a Tracer instance that we can use to create
spans in our application.
If we want to enable distributed tracing, we have to setup OpenTelemetry context propagation:
global::set_text_map_propagator(TraceContextPropagator::new());
Now first, we have to create a SpanExporter instance that will send the
data to the collector. We will use the opentelemetry_otlp crate for this:
    let otlp_endpoint = otlp_target.address.as_str();

    let mut builder = opentelemetry_otlp::SpanExporter::builder()
        .with_http()
        .with_endpoint(otlp_endpoint);

    if let Some(authorization) = &otlp_target.authorization {
        let mut headers = HashMap::new();
        headers.insert(String::from("Authorization"), authorization.clone());
        builder = builder.with_headers(headers);
    };

    let exporter = builder.build()?;
We create the SpanExporter instance with the HTTP transport and the
address of the collector. If the authorization key is set, we add it to
the headers of the HTTP request. Finally, we build the exporter.
Next, we have to create a TracerProvider instance that will provide the
Tracer instances to our application. The provider uses our already created
exporter to send the data to the collector. We also have to specify that
we are using the tokio async runtime.
    let tracer_provider = trace::TracerProvider::builder()
        .with_batch_exporter(exporter, runtime::Tokio)
        .with_config(
            trace::Config::default()
                .with_sampler(Sampler::AlwaysOn)
                .with_id_generator(RandomIdGenerator::default())
                .with_max_events_per_span(64)
                .with_max_attributes_per_span(16)
                .with_max_events_per_span(16)
                .with_resource(Resource::new(vec![KeyValue::new(
                    "service.name",
                    "sample_application",
                )])),
        )
        .build();

    Ok(tracer_provider.tracer("sample_application"))
We configured the provider with same sane defaults. Most of these are optional, we just added them to demonstrate the possibilities. We also set an service name, we can use this to identify the service in the collector.
Finally, we have to modify the serve function in src/commands/serve.rs to
initialize the OpenTelemetry
integration when an OtlpTarget is defined in the settings.
First, we create the telemetry_layer that will be used to forward the
tracing events to the collector. Notice, that this is an Option, because
we only want to use it if the OtlpTarget is defined in the settings.
    let telemetry_layer = if let Some(otlp_target) = settings.logging.otlp_target.clone() {
        let tracer = init_tracer(&otlp_target)?;
        Some(tracing_opentelemetry::layer().with_tracer(tracer))
    } else {
        None
    };
Then we create the stdout_log layer that will write the events to the
standard output:
    let stdout_log = tracing_subscriber::fmt::layer().with_filter(
        tracing_subscriber::EnvFilter::try_from_default_env()
            .unwrap_or(tracing_subscriber::EnvFilter::new("info")),
    );
This time we use the EnvFilter to set the log level based on the
RUST_LOG environment variable (possible values for global configuration:
trace, debug, info, warn, error). We will use the info level
as the default. For more information about the EnvFilter see the
documentation.
Finally, we create the subscriber with the telemetry_layer and the
stdout_log layer:
    let subscriber = tracing_subscriber::registry()
        .with(telemetry_layer)
        .with(stdout_log);

    subscriber.init();
Luckily, the tracing crate accepts optionals as the layers, so we can
simply pass the telemetry_layer and the stdout_log to the with method
of the registry and it will work as expected.
Now we are ready to send tracing events to the collector, but we have to add instrumentation to our application to actually send some events.
For example, we can add a layer to our axum configuration to trace all
the requests in src/api/mod.rs. We used the example from axum's repository:
pub fn configure(state: Arc<ApplicationState>) -> Router {
    Router::new()
        .merge(SwaggerUi::new("/swagger-ui").url(
            "/v1/api-docs/openapi.json",
            crate::api::v1::ApiDoc::openapi(),
        ))
        .nest("/v1", v1::configure(state))
        .layer(
            TraceLayer::new_for_http().make_span_with(|request: &Request<_>| {
                // Log the matched route's path (with placeholders not filled in).
                // Use request.uri() or OriginalUri if you want the real path.
                let matched_path = request
                    .extensions()
                    .get::<MatchedPath>()
                    .map(MatchedPath::as_str);

                tracing::info_span!(
                    "http_request",
                    method = ?request.method(),
                    matched_path,
                )
            }),
        )
}
We can also manually instrument our code with the tracing crate. For
example on a specific endpoint:
#[utoipa::path(
    get,
    path = "/hello",
    tag = "hello",
    responses(
        (status = 200, description = "Hello World", body = String),
    ),
)]
#[instrument(skip(state))]
pub async fn hello(State(state): State<Arc<ApplicationState>>) -> Result<String, StatusCode> {
    tracing::info!("Hello world!");
    Ok(format!(
        "\nHello world! Using configuration from {}\n\n",
        state
            .settings
            .load()
            .config
            .location
            .clone()
            .unwrap_or("[nowhere]".to_string())
    ))
}
We had to skip the state parameter, because the instrument attribute
does not support parameters that are not debuggable, and it does not
carry useful information for the tracing anyway.
For more detailed information about the instrument attribute see the
documentation.
We can also add further events within the instrumented function, see the
tracing::info!("Hello world!"); line in the example above.
Now we can start the application with the OpenTelemetry integration enabled.
To enable logging to the console set the RUST_LOG environment variable:
$ export RUST_LOG="trace"
To enable the OpenTelemetry integration, set the
APP__LOGGING__OTLP_TARGET__ADDRESS environment variable:
$ export APP__LOGGING__OTLP_TARGET__ADDRESS="https://in-otel.hyperdx.
io/v1/traces"
and the APP__LOGGING__OTLP_TARGET__AUTHORIZATION environment variable:
$ export APP__LOGGING__OTLP_TARGET__AUTHORIZATION="<YOUR_API_KEY>"
Now we can compile and run the application. If you checked out the source code from github, do not forget to start and initialize the database first, see the Persistence section for more information.
$ cargo build
$ ./target/debug/cli_app serve
To test the integration, we can use the curl command to send a request to
the API:
$ curl -v http://127.0.0.1:8080/v1/hello
In the console output you can already see the tracing events and the connection to the collector:
DEBUG reqwest::connect: starting new connection: https://in-otel.hyperdx.io/
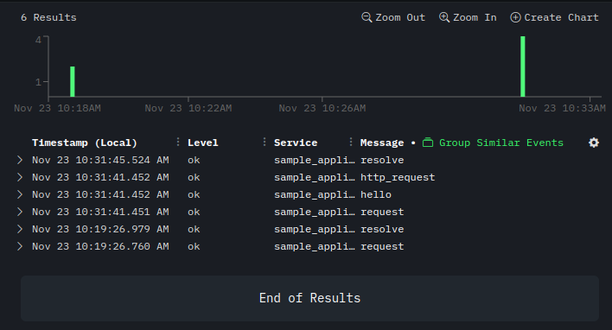
On the HyperDX site you can see the traces in the Search section. For example, the list of traces:
 .
.
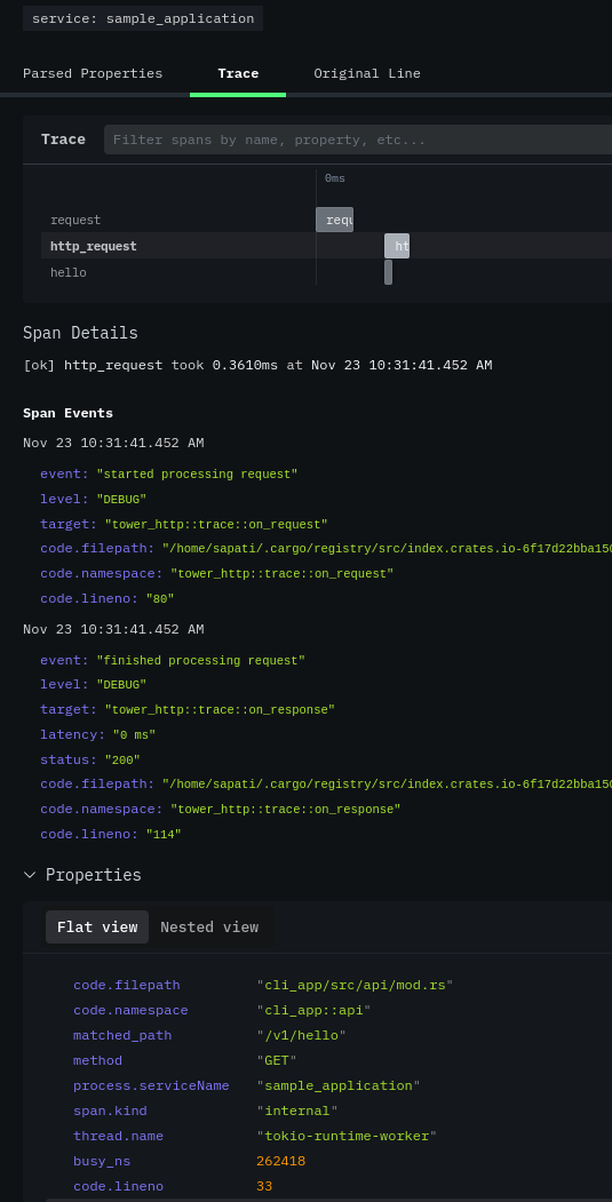
After clicking on the http_request span, you can see the details of the trace:
 .
.
This is a very basic example of OpenTelemetry integration. You can add more instrumentation to your application to get more detailed traces. But keep in mind that the more events you send, the more data you have to store and process. You should always consider the costs and benefits of the data you collect.